The Ultimate Guide to Trendline Trading: Unlock Profits with Breakouts and Bounces
The financial markets, whether stocks, forex, cryptocurrencies, or commodities, often appear chaotic. Yet, beneath the surface noise, patterns emerge, and trends develop. For technical traders, identifying and capitalizing on these trends is paramount. One of the most fundamental, yet powerful, tools in a trader's arsenal is the humble trendline.
Trendline trading is a cornerstone of technical analysis, offering a visual and effective way to gauge market direction, identify potential entry and exit points, and manage risk. While simple in concept, mastering trendline analysis requires understanding its nuances, the different strategies it enables, and crucially, how context like timeframes and instrument behavior shapes its application.
This comprehensive guide will delve deep into the world of trendline trading. We'll cover everything from the basics of drawing trendlines to exploring two potent strategies: trading retraces (bounces) and trading breakouts. We'll also emphasize the critical importance of multi-timeframe analysis and understanding how different instruments react to these lines. Whether you're a novice trader looking for foundational techniques or an experienced one seeking refinement, this guide will equip you with the knowledge to effectively incorporate trendline trading into your strategy.
Primary Keyword: trendline trading
Table of Contents
-
What Exactly is a Trendline? The Foundation of Trendline Trading
-
Defining Trendlines
-
The Purpose: Visualizing Market Direction
-
How to Draw Trendlines Correctly (Uptrends & Downtrends)
-
Subjectivity vs. Objectivity in Drawing Trendlines
-
The Significance of Slope and Touches
-
-
Why Trendlines are a Trader's Best Friend
-
Clarity in Chaos: Visualizing the Trend
-
Dynamic Support and Resistance
-
Reflecting Market Psychology
-
Identifying Potential Entry and Exit Zones
-
A Framework for Risk Management
-
-
Trendline Trading Strategy 1: Riding the Wave with Retraces (Bounces/Rejections)
-
The Core Concept: Trading With the Trend
-
Executing the Strategy in an Uptrend (Buying the Dip)
-
Identification
-
Waiting for the Pullback
-
Seeking Confirmation (Candlesticks, Oscillators, Price Action)
-
Entry, Stop-Loss, and Profit Targets
-
-
Executing the Strategy in a Downtrend (Selling the Rally)
-
Identification
-
Waiting for the Rally
-
Seeking Confirmation
-
Entry, Stop-Loss, and Profit Targets
-
-
Pros and Cons of the Retrace Strategy
-
-
Trendline Trading Strategy 2: Catching the Shift with Breakouts
-
The Core Concept: Trading Trend Changes or Accelerations
-
Executing the Bearish Breakout (Uptrend Line Break)
-
Identification
-
Confirming the Break (Volume, Candle Close)
-
The Pullback Confirmation (Optional but Powerful)
-
Entry, Stop-Loss, and Profit Targets
-
-
Executing the Bullish Breakout (Downtrend Line Break)
-
Identification
-
Confirming the Break
-
The Pullback Confirmation
-
Entry, Stop-Loss, and Profit Targets
-
-
The Challenge of False Breakouts (Whipsaws)
-
Pros and Cons of the Breakout Strategy
-
-
The Critical Factor: Context Matters in Trendline Trading
-
The Power of Multiple Timeframe Analysis (MTFA)
-
Aligning Signals Across Timeframes
-
Using Higher Timeframes for Direction, Lower for Entry
-
-
Instrument Susceptibility: Not All Markets are Created Equal
-
Identifying Trend-Friendly vs. Range-Bound Instruments
-
The Importance of Observation and Backtesting
-
-
Parameter Tuning: Finding What Works for You
-
Wicks vs. Bodies
-
Angle and Touch Count Preferences
-
The Need for Empirical Testing
-
-
-
Enhancing Your Trendline Trading: The Power of Confluence
-
Combining Trendlines with Other Technical Tools
-
Moving Averages
-
Oscillators (RSI, MACD, Stochastics)
-
Volume Analysis
-
Fibonacci Levels
-
Horizontal Support & Resistance Zones
-
Candlestick Patterns
-
-
Why Confluence Increases Probability
-
-
Essential Risk Management for Trendline Traders
-
The Non-Negotiable Stop-Loss
-
Prudent Position Sizing
-
Favorable Risk/Reward Ratios
-
Managing Open Trades Effectively
-
-
Putting It All Together: A Practical Mindset
-
Conclusion: Mastering the Lines
1. What Exactly is a Trendline? The Foundation of Trendline Trading
Spoiler - Don't trade your capital use Apex....
Before diving into strategies, let's establish a clear understanding of what trendlines are.
-
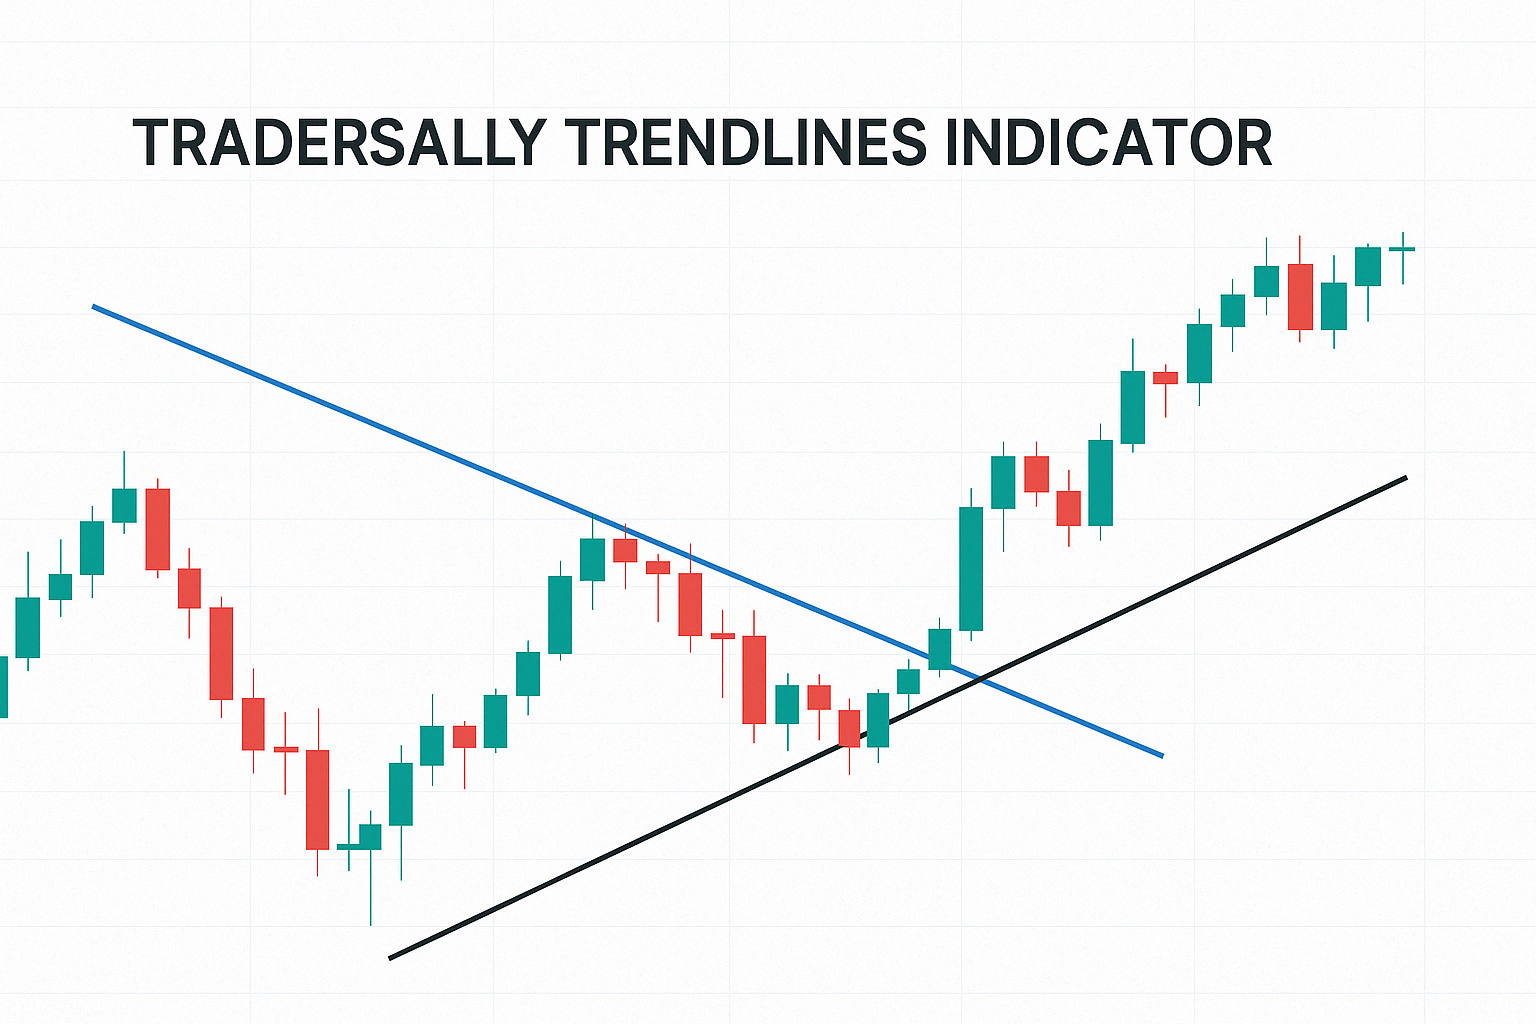
Defining Trendlines: A trendline is a straight line drawn on a price chart connecting a series of ascending lows (in an uptrend) or descending highs (in a downtrend). It acts as a visual guide to the prevailing direction and steepness of a trend.
-
The Purpose: Visualizing Market Direction: At its core, a trendline makes the direction of price movement immediately apparent. Is the market generally moving up, down, or sideways? A trendline cuts through the noise of individual candle fluctuations to reveal the underlying momentum.
-
How to Draw Trendlines Correctly:
-
Uptrend Line: Connect at least two significant swing lows. Ideally, these lows should be progressively higher (higher lows). The line is drawn below the price action and acts as potential support.
-
Downtrend Line: Connect at least two significant swing highs. Ideally, these highs should be progressively lower (lower highs). The line is drawn above the price action and acts as potential resistance.
-
Minimum Touches: While two points define a line, a trendline gains significance and reliability with three or more touches. Each time the price respects the line, it reinforces its validity in the eyes of market participants.
-
-
Subjectivity vs. Objectivity: Drawing trendlines involves a degree of subjectivity. Should you connect the exact highs/lows (wicks) or the candle bodies? Which swing points are truly "significant"? There's no single "correct" way, but consistency is key. Experienced traders often look for the line that captures the "spirit" of the trend and has the most reaction points.
-
The Significance of Slope and Touches:
-
Slope: The angle of the trendline indicates the trend's strength or momentum. A steep slope suggests a strong, potentially unsustainable trend, while a gentler slope indicates a more measured, possibly more durable trend.
-
Touches: As mentioned, the more times a trendline is tested and holds (price touches it and reverses), the more significant it becomes. A well-established trendline is watched by many traders, increasing its potential impact.
-
2. Why Trendlines are a Trader's Best Friend
Trendlines are popular for several compelling reasons:
-
Clarity in Chaos: They provide a simple visual framework to understand complex price movements.
-
Dynamic Support and Resistance: Unlike horizontal support and resistance levels, trendlines adapt to the market's flow, providing moving levels where buyers (uptrend) or sellers (downtrend) might step in.
-
Reflecting Market Psychology: A respected uptrend line shows consistent buying interest on dips. A respected downtrend line shows consistent selling pressure on rallies. A break suggests a potential shift in this underlying psychology.
-
Identifying Potential Entry and Exit Zones: The core function for traders. Trendlines signal potential areas to enter trades (on bounces or breakouts) and potentially exit trades (if the line breaks against the position or price reaches a target projected from it).
-
A Framework for Risk Management: Trendlines offer logical places to set stop-loss orders. If you buy a bounce off an uptrend line, your stop can go just below it. If you short a break below an uptrend line, your stop can go just above it.
3. Trendline Trading Strategy 1: Riding the Wave with Retraces (Bounces/Rejections)
This is often considered the more conservative trendline trading strategy, as it involves trading in the direction of the established trend. The idea is to enter the market when the price pulls back to the trendline and shows signs of resuming the trend in other words we use trendline breakout and retest.
-
The Core Concept: Assume the established trend will continue. Buy the dip in an uptrend; sell the rally in a downtrend, using the trendline as the action zone.
-
Executing the Strategy in an Uptrend (Buying the Dip):
-
Identification: Identify a clear uptrend with a valid trendline connecting at least two, preferably three or more, higher lows.
-
Waiting for the Pullback: Patiently wait for the price to retrace (pull back) towards the ascending trendline. Don't chase the price higher.
-
Seeking Confirmation: This is crucial to avoid entering prematurely or on a false signal. Look for signs that buyers are stepping in at or near the trendline:
-
Bullish Candlestick Patterns: Hammer, Bullish Engulfing, Piercing Line, Morning Star forming right on or just above the trendline.
-
Oscillator Signals: RSI or Stochastics reaching oversold levels and potentially turning up, or showing bullish divergence (price makes an equal or slightly lower low near the trendline, but the oscillator makes a higher low).
-
Price Action: Observe if the downward momentum slows as price approaches the line, with smaller bearish candles followed by emerging bullish candles.
-
-
Entry, Stop-Loss, and Profit Targets:
-
Entry: Enter long after confirmation of the bounce (e.g., on the close of a strong bullish confirmation candle).
-
Stop-Loss: Place the stop-loss order logically below the trendline and the recent swing low formed during the pullback. Allow some buffer for volatility.
-
Profit Targets: Aim for the previous swing high, a measured move projection, or use a fixed risk/reward ratio (e.g., 1:2, 1:3). Trailing stops can also be used, potentially moving them up below subsequent higher lows.
-
-
-
Executing the Strategy in a Downtrend (Selling the Rally):
-
Identification: Identify a clear downtrend with a valid trendline connecting at least two, preferably three or more, lower highs.
-
Waiting for the Rally: Wait for the price to rally (retrace) up towards the descending trendline. Avoid shorting near the lows.
-
Seeking Confirmation: Look for signs that sellers are re-emerging near the trendline:
-
Bearish Candlestick Patterns: Shooting Star, Bearish Engulfing, Dark Cloud Cover, Evening Star forming right on or just below the trendline.
-
Oscillator Signals: RSI or Stochastics reaching overbought levels and potentially turning down, or showing bearish divergence (price makes an equal or slightly higher high near the trendline, but the oscillator makes a lower high).
-
Price Action: Observe if the upward momentum stalls near the line, with smaller bullish candles followed by emerging bearish candles.
-
-
Entry, Stop-Loss, and Profit Targets:
-
Entry: Enter short after confirmation of the rejection.
-
Stop-Loss: Place the stop-loss order logically above the trendline and the recent swing high formed during the rally.
-
Profit Targets: Aim for the previous swing low, a measured move projection, or use a fixed risk/reward ratio.
-
-
-
Pros and Cons of the Retrace Strategy:
-
Pros: Trading with the prevailing trend generally offers a higher probability of success. Provides clear entry and stop-loss points. Can offer good risk/reward opportunities.
-
Cons: Requires patience to wait for the optimal setup. Trends eventually end, and you might enter just before the trendline breaks. False bounces can occur, triggering stop-losses.
-
4. Trendline Trading Strategy 2: Catching the Shift with Breakouts
This trendline trading strategy involves trading against the previously established trend, anticipating a reversal or significant acceleration after the price decisively breaks through the trendline.
-
The Core Concept: A break of a significant trendline signals that the balance between buyers and sellers is shifting. Trade in the direction of the break.
-
Executing the Bearish Breakout (Uptrend Line Break):
-
Identification: Identify a well-established uptrend line. The longer the line has been in place and the more times it has been touched, the more significant its break.
-
Confirming the Break: Don't jump the gun on just a wick poking through. Look for a decisive break:
-
Candle Close: The price should close significantly below the trendline. A strong, large bearish candle closing below is a good sign.
-
Volume (Optional but Recommended): Ideally, the breakout should occur on increased volume, suggesting strong conviction from sellers.
-
-
The Pullback Confirmation (Optional but Powerful): Often, after a breakout, the price will pull back to retest the broken trendline from the underside. This formerly supportive line now acts as resistance. A rejection from this retest level provides a higher probability short entry.
-
Entry, Stop-Loss, and Profit Targets:
-
Entry: Enter short either on the decisive close below the trendline (more aggressive) or after confirmation of rejection on a pullback to the broken line (more conservative).
-
Stop-Loss: Place the stop-loss above the broken trendline and ideally above the swing high formed during the breakout or pullback/retest phase.
-
Profit Targets: Look for the next major horizontal support level, a measured move target (often calculated based on the height of the previous trend channel), or use risk/reward ratios.
-
-
-
Executing the Bullish Breakout (Downtrend Line Break):
-
Identification: Identify a well-established downtrend line.
-
Confirming the Break: Look for a decisive close above the trendline, preferably on increased volume.
-
The Pullback Confirmation: Wait for a potential pullback to the broken trendline (now acting as support) and look for signs of a bounce off it.
-
Entry, Stop-Loss, and Profit Targets:
-
Entry: Enter long on the decisive close above the line or after confirmation of a successful retest (bounce) of the broken line.
-
Stop-Loss: Place the stop-loss below the broken trendline and ideally below the swing low formed during the breakout or pullback/retest phase.
-
Profit Targets: Look for the next major horizontal resistance level, a measured move target, or use risk/reward ratios.
-
-
-
The Challenge of False Breakouts (Whipsaws): The biggest danger with breakout trading is the "false breakout" or "whipsaw." This occurs when the price breaks the trendline, triggering entries, only to quickly reverse back within the trend, stopping traders out. Waiting for confirmation (like a candle close or a pullback/retest) can help filter some false breaks, but not all. Volume analysis can also help distinguish genuine breaks from weak ones.
-
Pros and Cons of the Breakout Strategy:
-
Pros: Potential to catch the beginning of major new trends or accelerations, leading to significant profits. Can offer clear entry signals.
-
Cons: Prone to false breakouts, which can lead to frustrating losses. Requires careful confirmation and potentially quicker reactions. Can feel psychologically uncomfortable as you are initially trading against the direction of the recently established trend.
-
5. The Critical Factor: Context Matters in Trendline Trading
Here's where many traders falter: applying trendline strategies in isolation without considering the broader market context. As the prompt rightly emphasizes, understanding timeframes and instrument behavior is crucial.
-
The Power of Multiple Timeframe Analysis (MTFA):
-
A trendline break on a 5-minute chart might be insignificant noise within a strong uptrend on the Daily chart. Conversely, a bounce off a Daily uptrend line provides a strong bullish bias for looking for intraday long entries.
-
How to Use It:
-
Identify the Primary Trend: Start with a higher timeframe (e.g., Daily or Weekly) to determine the dominant market direction.
-
Look for Alignment: If the Daily chart is in an uptrend, prioritize looking for retrace/bounce setups on lower timeframes (e.g., H4, H1) in the direction of the Daily trend.
-
Identify Potential Reversals: If a major trendline on the higher timeframe breaks, then start looking for breakout confirmation and setups on the lower timeframes in the direction of that higher timeframe break.
-
-
MTFA provides context and filters trades. Trading a 15-minute trendline bounce in alignment with a Daily uptrend generally has a higher probability than trading it against the Daily trend.
-
-
Instrument Susceptibility: Not All Markets are Created Equal:
-
Some instruments (certain currency pairs like EUR/USD, major indices like S&P 500) tend to exhibit relatively clean trending behavior and respect technical levels like trendlines more consistently.
-
Other instruments (volatile small-cap stocks, certain cryptocurrencies, choppy commodities) might break trendlines frequently, generating many false signals for breakout traders and frustrating retrace traders. These might be better suited for range-trading strategies or require different parameter settings for trendlines.
-
How to Determine Susceptibility: There's no substitute for empirical observation and testing.
-
Pick an instrument and timeframe you are interested in.
-
Go back through historical charts.
-
Draw trendlines according to consistent rules.
-
Observe: How often does the price respect the trendline (suggesting retrace strategies might work well)? How often does it break decisively, leading to a sustained move (suggesting breakout strategies could be viable)? How frequent are false breakouts?
-
Keep a log of your observations. This data will tell you if that specific instrument/timeframe combination is generally "susceptible" to reliable trendline bounces or breakouts.
-
-
-
Parameter Tuning: Finding What Works for You:
-
This ties into instrument susceptibility. Do you get better results connecting wicks or bodies on Forex charts versus Stock charts? Does requiring 3 touches filter out too many good trades on a specific index, or is it essential to avoid noise? Is a very steep trendline reliable for bounces, or does it break easily?
-
Experiment: Try different ways of drawing lines (wicks vs. bodies, minimum touches, angle considerations) on the same historical data for your chosen instrument. See which approach yielded more reliable signals for that specific context. This is part of developing your personalized edge.
-
6. Enhancing Your Trendline Trading: The Power of Confluence
Trendlines become significantly more powerful when used in conjunction with other technical analysis tools. This concept is known as confluence, where multiple independent signals align to support a particular trading decision.
-
Combining Trendlines with Other Technical Tools:
-
Moving Averages: A bounce off an uptrend line that coincides with a key moving average (e.g., 50 EMA, 200 SMA) provides stronger confirmation. A break of a trendline and a key moving average simultaneously is a stronger breakout signal.
-
Oscillators (RSI, MACD, Stochastics): As mentioned in the strategy sections, these are invaluable for confirming bounces (oversold/bullish divergence) and rejections (overbought/bearish divergence), and potentially spotting weakening momentum before a breakout.
-
Volume Analysis: Increased volume confirms conviction. High volume on a bounce strengthens the signal; high volume on a breakout makes it more believable. Low volume on a break might suggest a false move.
-
Fibonacci Levels: Finding a trendline touch that aligns perfectly with a key Fibonacci retracement level (e.g., 50% or 61.8%) creates a high-probability zone for a reversal (in retrace trading). Fibonacci extensions can help set profit targets after breakouts.
-
Horizontal Support & Resistance Zones: When a trendline intersects with a strong horizontal support or resistance level, that price area becomes a critical inflection point. Bounces or breaks from such junctions are often very significant.
-
Candlestick Patterns: Specific candle patterns appearing right at the trendline provide immediate, visual confirmation for entry timing.
-
-
Why Confluence Increases Probability: Each indicator or tool looks at the market from a slightly different perspective (trend, momentum, volatility, key levels). When multiple, independent perspectives all point to the same conclusion (e.g., "buy here"), the probability of that outcome occurring increases significantly compared to relying on just one signal.
7. Essential Risk Management for Trendline Traders
No trading strategy is foolproof, and trendline trading is no exception. Effective risk management is crucial for long-term survival and profitability.
-
The Non-Negotiable Stop-Loss: Always use a stop-loss order. Trendlines provide logical placement areas (just beyond the line and the recent swing point), but always define your maximum acceptable loss before entering a trade.
-
Prudent Position Sizing: Calculate your position size based on your stop-loss distance and your predetermined risk per trade (e.g., 1-2% of your trading capital). Never risk too much on a single trendline setup, no matter how perfect it looks.
-
Favorable Risk/Reward Ratios: Only take trades where the potential profit (distance to your target) is significantly greater than your potential loss (distance to your stop-loss). Aim for at least 1:2 or 1:3 R/R. This means you can be wrong more often than right and still be profitable.
-
Managing Open Trades Effectively: Consider using trailing stops (manually moving your stop-loss up below new higher lows in an uptrend, or down above new lower highs in a downtrend) to lock in profits as the trend progresses. Know when to take partial profits at key levels.
8. Putting It All Together: A Practical Mindset
Successfully implementing trendline trading involves:
-
Observation: Constantly analyzing charts across different instruments and timeframes.
-
Identification: Spotting clear trends and drawing valid trendlines.
-
Patience: Waiting for the price to reach the trendline (for retraces) or break it decisively (for breakouts).
-
Confirmation: Looking for confluence factors and specific entry triggers before committing capital.
-
Execution: Entering the trade with a pre-defined stop-loss and profit target.
-
Management: Monitoring the trade and adjusting stops or taking profits as planned.
-
Review: Learning from both winning and losing trades to refine your approach. Remember that testing on specific instruments and timeframes is key to understanding their susceptibility to bounces vs. breaks.
9. Conclusion: Mastering the Lines
Trendline trading is a versatile and powerful approach applicable across various financial markets. By understanding how to draw trendlines correctly and implementing the two core strategies – trading retraces (bounces) and trading breakouts – you can unlock numerous trading opportunities.
However, success hinges on more than just drawing lines. It requires a deep understanding of market context, primarily through multiple timeframe analysis and instrument-specific testing. Discovering whether a particular stock, currency pair, or commodity tends to respect trendlines (favoring retrace strategies) or break them decisively (favoring breakout strategies) is crucial information derived from diligent chart study.
Always enhance your signals through confluence by incorporating other technical indicators and patterns. Most importantly, underpin your entire approach with robust risk management.
Trendlines are not a magic bullet, but they provide an invaluable framework for analyzing market structure and identifying high-probability trading setups. Start practicing on a demo account, meticulously observe different instruments, test diligently, and integrate these techniques into your trading plan. With discipline and continuous learning, mastering trendline trading can significantly enhance your ability to navigate and profit from the financial markets.
Keywords for SEO: trendline trading, technical analysis, trading strategies, chart patterns, support and resistance, dynamic support, dynamic resistance, breakout trading, retrace trading, bounce trading, trend following, trend reversal, multiple timeframe analysis, MTFA, risk management, forex trading strategies, stock trading strategies, crypto trading strategies, how to draw trendlines, confluence trading.